Ad Imprints
.png)
Internal Dashboard design for Zapr. This platform was designed for better control over running campaigns and creating reports for the same.
Overview
The brief was to build a DSP (Demand Supply Platform) that gives end-users the ability to manage campaigns, surveys & user segments under one single platform.
AD Imprints is a one-point source for In-depth mobile campaign analytics. The motive was to get rid of all the internal platforms we are currently using for campaign management. Consolidate all of them into Ad Imprints.
The various components of the dashboard are:
-
Campaign Management
-
User Management
-
Survey Management
-
Segment Management
-
Reporting / Monitoring
-
Billing Management
Roles
UX Research, Prototyping, Art Direction, UI Design (Team Project)
Platform
Web
Duration
6 months
My Role
I worked closely with the Engineering teams to understand technical constraints and ensure design quality standards, the Product Manager to identify user needs, and adjust project goals as the project evolved, and the Customer Success team to better identify areas of student confusion.
As a designer on the team, I provide user experience aid to other teams My responsibilities range from being one of the core designers responsible for creating UX patterns, guidelines, and standards for the dashboard and serve as a designer in the R&D of the project.
Defining the sprint
Given the short deadline, I decided to use the Double Diamond methodology as a very general guideline.

01
Understanding the user needs
AD Imprints helps to bring together all the various platforms used currently, to a one-point user source. Through this dashboard, the users wouldn’t have to go anywhere else and everything is found in one place. Currently, the users have to use different platforms for carrying out a small task, like running a campaign. As an important, foundational step, I asked some critical questions to understand the problem thoroughly.
How might we combine all the different dashboards?
How might we bring in a good user experience?
How might we provide creative editability option in the dashboard?
How do we provide the user easy targeting option for the campaign setup?
To better understand the target user base, I interviewed a few of the internal members to understand their needs, pain points, and their general behavior while using the dashboard. This allowed me to generate user insights, personas, and better empathize with the users.
Challenges
1. Improve navigation and user flow
The dashboard has many sections and each section needed to be clear and easily toggleable to use.
2. The billing management section
Incorporating multiple columns in a user-friendly manner and providing the option to easily switch and export the data accordingly to the requirements.
3. Coordinating with all teams
As the dashboard was supposed to be used by many internal teams, it was very difficult to incorporate everyone's feedback and keeping everyone in the loop. Hence the project much more time to be accomplished.
4. The right user experience for all user types
Using personas to define pain points
There are two kinds of users for the dashboard - the internal team members and the clients. There were various user personas created, a few of which are listed below. The names used are different to maintain confidentiality.
My goal was to understand the challenges they faced and the workarounds they employed.

Manish Seth
Gender: Male
Age: 31 yrs
Occupation: Ad Operations Manager – QA
From: Bangalore
Manish has helped AdOps manage critical campaigns across regions & in the process acquired a good understanding of Zapr systems.
GOALS
To create a single dashboard for the entire process, and improve the survey preview system.
FRUSTRATIONS
I can’t create and run the survey smoothly. He has to create a survey on a different dashboard, later run the survey on a different dashboard. While creating a survey, he faces a lot of issues in previewing the survey.

Raj Sinha
Gender: Male
Age: 36yrs
Occupation: AVP - Digital Advertising Operations
From: Bangalore
Raj has helped in the
• Revenue analysis for the product & identifying a trend.
• Part of business intelligence team for Ad Networks - CPC analysis
• Assisting in developing the Annual Organization plan (AOP)
GOALS
To create an easy mechanism to download and share the report. To create a monitoring section in the dashboard with better user experience.
FRUSTRATIONS
Faces a lot of problems to share the report with clients and also the campaign details with the finance team to generate an invoice.
03-04
Decide/Sketch
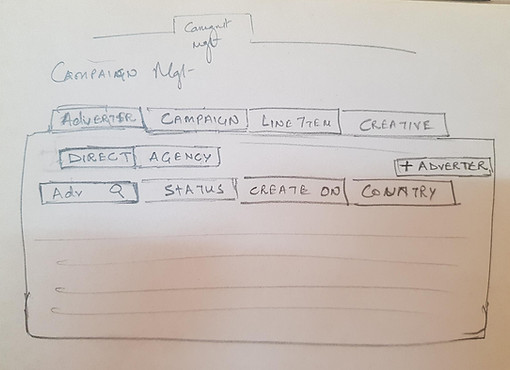
Once the research data was collected, I started to sketch the key features of the dashboard and started to analyze the flow. There was a challenge here as creating the user flow was an extremely difficult task, as in the real scenario, there are small additions constantly coming in, which creates a mess in the user flow. So sketching the flow of the dashboard in this situation was the best idea, so that there is no back and bro in the later on steps.


Initial Sketches
Information Architecture was build based on the user flow obtained by interviews and observational methods. The user flow shown here is an overview and a very basic view, as the detailed view keeps changing over time.

02
Defining the goals
In this step, the data from the previous step was used to define the goals better.
The goal is to produce new knowledge and deepen understanding of the dashboard. We start off with finding the right information which will help the product that we develop to succeed. Some of the goals of the project are listed below.
-
The goal is to build a DSP platform that gives the end-users the ability to manage campaigns, surveys, & user segments
-
Get rid of all the internal platforms we are currently using for campaign management. Consolidate all of them into Adimprints.
-
The idea is to move Solr and Jenken capabilities in the new advertiser console. Users should not be made to go to a different platform to generate audience segments/user ids. Audience creation should be available in the sample platform where campaigns are setup.
-
Enhance visibility and re-usability.
-
Creating designs compatible with multiple devices.
KEY GOAL
Create an elegant solution for a complicated platform where everyone can do everything.
Further iterations
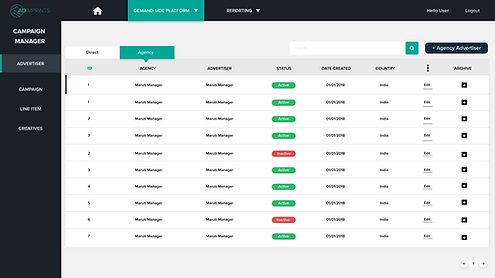
After analyzing the initial sketches, I began to draw some questions to either validate or invalidate my design decisions. This would allow me to refine and decide what worked and didn’t work. A progression of key screens from low to high fidelity wireframes with annotations. High fidelity wireframes were built based on sketches. All the icon sizes were based on Google’s material and Adobe XD material design guidelines.


05
Prototyping, Usability Testing, and Feedback
After finalizing the wireframe and sketches, I brought my initial wireframe to the mid-fidelity prototype, using Material Ui as the frame. I created the prototypes for different sections using Adobe XD.
I conducted usability tests to further improve my designs to make the dashboard more pleasing and intuitive to use. The process yielded a number of valuable feedback which helped in improving the dashboard and allowed me to make more thoughtful decisions and reach my goals.
Getting user opinions and testing data proved to show some weaknesses in the initial designs. I went back and reiterated the designs in order to strengthen the user's experience.


User Feedback
"The colors and icons used are very bold."
" The ad campaign id name is going to be way longer than the available space."
"There should be an option to export the report of each campaign"
"How do I change the settings of a line item"
" How do I create separate groups to target groups on different shows, channels, genres, and timings?"
06
Wrapping up the dashboard, I created a high-fidelity prototype featuring in-depth animations to present to my team and stake holders.
Final Designs


Learnings
1. The design sprint is essential
Following the design sprint is the important. The process followed by me helped a lot in reducing errors. Going back to the user and testing with the users is always the best way to improvise your product.
2. Team Collaboration is important
It is important to keep taking feedback from inter teams and have a check on their progress. The duration of this project became longer due to a lack of communication between other teams.
3. Sketching is Ideal
Sketching helps in figuring out errors in your product in a faster and less time-consuming manner.
